
Understanding how well your Amazon business is performing requires more than relying on guesswork or instinct. The real driver of growth lies in using accurate, actionable data to guide decisions.
If you’ve spent time inside Seller Central, you may have noticed a powerful yet often ignored section filled with data—the Amazon Business Reports. At first glance, the reports may look complex due to their heavy use of numbers and tables, which causes many sellers to overlook their importance.
In this guide, we’ll break down Amazon Seller Central business reports and explain the valuable data they provide. By learning how to interpret the right metrics, you can uncover insights that help improve decision-making and scale your Amazon business more effectively.
Now is the time to turn raw numbers into strategies that drive consistent growth.
What Are Amazon Business Reports and Where Can You Find Them?
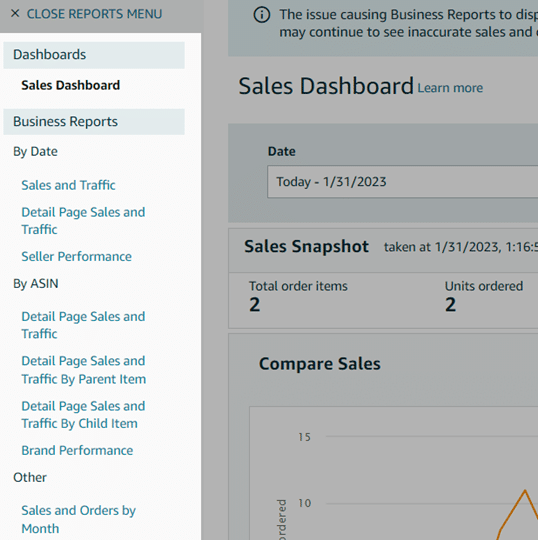
Amazon Business Reports provide sellers with detailed data related to sales, traffic, and customer behavior. These reports are available inside Seller Central under the Reports tab in the main menu.
Not every data point in these reports is equally useful. Some metrics carry more value than others when it comes to improving performance. Additionally, access to reports can vary—some are available to all sellers, while others are limited to FBA sellers or brand-registered accounts.
Sellers who fulfill their own orders can find business reports under the Reports section, along with sales and tax reports. Over time, this data helps sellers analyze trends and use historical insights to improve advertising performance and sales strategies.
Why Amazon Business Reports Matter
Seller Central places a wealth of data right at your fingertips. These reports show how customers interact with your listings, how frequently they make purchases, and how many units they order per transaction.
This information plays a critical role in business growth. When used correctly, it helps you understand buying patterns, optimize listings, and build smarter sales strategies that support long-term success on Amazon.
Types of Amazon Business Reports
Amazon provides three primary business report categories:
Sales Dashboard
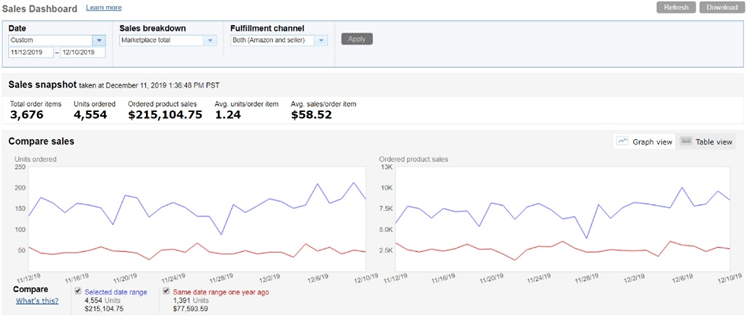
The Sales Dashboard offers a quick overview of orders and revenue. It includes visual graphs that allow you to compare performance by day, week, month, or year. This report is ideal for tracking historical sales, units sold, and average order value at a glance.
Sales and Traffic Report
This report provides detailed insights into both traffic and sales metrics. Data can be viewed by custom date ranges or broken down daily, weekly, or monthly, making it useful for performance analysis over time.
Detail Page Sales and Traffic by ASIN
This report offers parent-level and child-level ASIN data, providing a deeper look at individual product performance. Sellers can analyze product-specific metrics over a selected time period for more precise optimization.
Key Metrics You Should Track
Although Seller Central provides numerous reports, focusing on the right metrics is essential for improving performance. Below are the most important ones to monitor:
- Units Ordered
- Total Sales
- Page Views
- Sessions
- Unit Session Percentage (Conversion Rate)
- Buy Box Percentage
Units Ordered
This metric reflects the total number of units purchased by customers. Monitoring units ordered helps you identify spikes and drops in demand.
Unit volume has a direct impact on product ranking. Higher unit sales often lead to improved visibility in Amazon search results. Tracking this metric ensures you can evaluate whether your sales velocity supports strong rankings.
Total Sales (Ordered Product Sales and Gross Sales)
Total sales are calculated by multiplying the product price by the number of units sold. Gross sales include additional charges such as shipping fees or gift wrapping costs, representing the total amount paid by the customer.
Why this metric is important
This data allows sellers to compare net sales and gross sales, helping them understand true profitability. Since revenue plays a role in ranking, aligning total sales with units ordered, page views, and sessions provides a clearer picture of overall performance.
Page Views
Page views represent how many times customers visit your Amazon listing pages. Amazon counts each page view separately, meaning multiple visits from the same customer increase the count.
How to use this data
Monitoring page views helps identify visibility issues. A decline often indicates poor exposure. If views are low, review Buy Box ownership, keyword optimization, product titles, and images. Increased traffic often leads to better conversions and stronger rankings.
Sessions
Sessions represent customer visits that include interactions across one or more pages within a defined period.
While page views track individual page loads, sessions measure overall user visits. Multiple page views can occur within a single session, depending on customer behavior.
How sessions help
If sessions are equal to page views, it may suggest customers are leaving after viewing only one page. This often leads to poor conversion rates. In such cases, review category placement, keyword relevance, listing quality, imagery, and pricing strategy.
Improving these factors can help increase engagement, sessions, and conversions.
Order Session Percentage (Conversion Rate)
This metric compares the number of orders placed to the number of sessions received.
For example, if 50 customers visit your listing and 25 make a purchase, your conversion rate is 50%. Higher conversion rates indicate stronger listing performance.
How to interpret this metric
A declining conversion rate or one that falls below the category average signals the need for optimization. Often, improving keyword targeting and listing relevance helps boost this metric.
Using SAECOM FBA PRO’s keyword research and competitor analysis services, sellers can identify high-performing keywords and improve both organic rankings and advertising results.
A healthy Amazon conversion rate typically falls between 10% and 15%, though this can vary by category.
Buy Box Percentage
Buy Box percentage shows how often your product appears as the default purchase option.
A high Buy Box share leads to increased sales and better rankings. Losing the Buy Box—due to stock shortages, pricing issues, or competition—negatively affects visibility and revenue.
How to improve Buy Box performance
Maintaining competitive pricing, strong seller metrics, fast shipping, and consistent inventory levels all help increase Buy Box ownership.
Amazon Business Reports: Additional Insights
Amazon Business Reports contain valuable information that supports business expansion and strategic planning. In addition to Seller Central data, SAECOM FBA PRO provides advanced reporting and demand analysis tools for sellers looking to scale efficiently.
How these insights help
One common challenge sellers face is estimating real marketplace demand. SAECOM FBA PRO uses Amazon demand signals to identify product opportunities and category-level insights, helping sellers understand both consumer and B2B demand trends.
Business buyers typically value customization, volume pricing, and reliability. With the right data, sellers can:
- Expand into international markets
- Use Amazon as part of an omnichannel strategy
- Understand category-level demand
- Fulfill bulk business orders
- Offer customized pricing for large purchases
Downloading and reviewing these reports helps sellers unlock new growth opportunities and increase market share.
Final Thoughts
Amazon Business Reports are a powerful resource for sellers who want to make data-backed decisions. While data analysis may feel overwhelming, focusing on the right metrics makes the process manageable and highly rewarding.
By understanding traffic, sales, and conversion patterns—and aligning those insights with clear business goals—you can position your Amazon store for long-term success. If interpreting data feels challenging, working with experienced partners like SAECOM FBA PRO can simplify the process and help you build a scalable, profitable Amazon business.
Turning data into action is what separates growing sellers from stagnant ones.