
Are you a beginner on Amazon struggling to choose the right niche? Or are you an experienced seller planning to expand your product range? Many sellers wish they had access to the same powerful market research tools that large brands use to identify gaps in demand and uncover untapped opportunities. You can do it by Amazon Product Opportunity Explorer.
With over 1.9 million active sellers on Amazon, competition is fierce. Sellers often invest significant money into market research just to understand customer preferences and pinpoint gaps in the marketplace.
But what if you could analyze competitors and spot profitable opportunities without spending heavily on external tools?
To simplify niche discovery, Amazon introduced the Product Opportunity Explorer — a free tool designed to help sellers understand customer interests and buying behavior at no extra cost.
In this guide, you’ll learn what Amazon Product Opportunity Explorer is, how it works, and how to use it strategically to uncover high-potential niches.
Let’s get started.
What Is Amazon Product Opportunity Explorer?
Product Opportunity Explorer is a free research feature within Amazon Seller Central that helps sellers analyze customer behavior using data-driven metrics. It allows you to identify new product opportunities and expand your catalog without investing in expensive third-party tools.
Beyond simply identifying potential niches, the tool also provides personalized niche suggestions based on your existing listings and sales performance. You can refine your research by searching through keywords or browsing by category to uncover profitable product ideas tailored to your business goals.
Whether you’re just launching your Amazon journey or scaling an established store, this tool can become a core part of your product research process thanks to its accurate data and user-friendly interface.
How to Discover a Product Niche Using Amazon Product Opportunity Explorer
The Product Opportunity Explorer is ideal for sellers looking to introduce a new product or expand an existing catalog. Here’s how to use it effectively.
Step 1: Start with a Broad Keyword
First, log in to your Seller Central account.
From the left-side navigation panel, go to Growth → Product Opportunity Explorer.
Once inside, you can browse by category, explore suggested niches, or perform a direct search using a keyword. The suggested niche section offers recommendations based on your current catalog and historical performance.
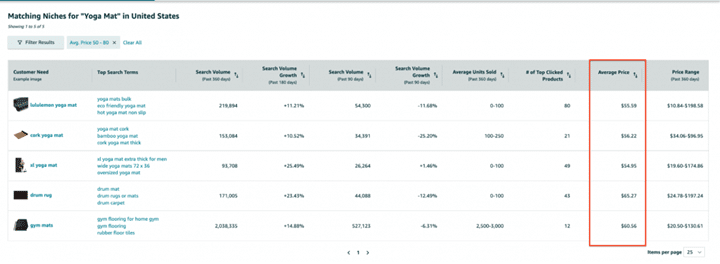
If you’re researching a new idea, enter a broad keyword in the search bar. For example, if you’re exploring opportunities in the yoga niche, you could type “yoga mat.”
After hitting search, the tool displays relevant niches, associated search terms, and important data points including:
- Customer Needs: Individual niches within Amazon.
- Top Search Terms: The top three highest-volume keywords in that niche.
- Search Volume (Past 360 & 90 Days): Displays how often customers search for that term annually and quarterly.
- Search Volume Growth: Compares current demand trends with previous periods to identify growth momentum.
- Units Sold (Past 90 Days): Total unit sales within the niche.
- # of Top Clicked Products: Number of products receiving 90% of customer clicks.
- Average Price (Past 90 Days): Average selling price across products.
- Price Range (Past 360 Days): Historical minimum and maximum pricing range.
These metrics provide a comprehensive overview of demand, competition, and pricing patterns.
Step 2: Apply Filters to Narrow Results
To refine your research, apply filters that match your business criteria.
For example, if you want to avoid low-priced items but don’t want to exceed $80, you could set a price range between $50 and $80. This helps eliminate products that don’t align with your profitability targets.
Filtering allows you to focus only on niches that meet your revenue and margin expectations.
Step 3: Identify a Promising Niche
Next, analyze Search Volume and Search Volume Growth over both 360-day and 90-day periods. Look for niches that demonstrate steady or increasing demand trends.
Pay attention to pricing as well. A healthy average price with positive growth suggests solid profit potential.
For instance, a niche like “XL yoga mat” might show both annual and quarterly growth along with attractive pricing — making it a strong candidate for deeper analysis.
Step 4: Evaluate the Niche in Detail
After selecting a niche, click into it to view the detailed dashboard. The niche page includes five main tabs:
- Products
- Search Terms
- Insights
- Trends
- Customer Review Insights
Product Tab: Understanding Market Dynamics
The Product section lists items that collectively capture 80% of clicks within the niche.
It includes metrics such as:
- Click Count
- Click Share (360 Days)
- Average Selling Price
- Total Ratings
- Average Rating
- Average BSR
- Number of Sellers/Vendors
From this data, you can assess:
Market Entry Difficulty
If products with high ratings and reviews dominate click share, customers strongly depend on social proof. This makes entry more competitive.
However, if click share is evenly distributed regardless of review count, the niche may be easier to enter.
Price Sensitivity
If lower-priced products consistently capture higher click share, the niche is price-sensitive.
If higher-priced items still receive strong click share, it suggests customers value quality and branding over just price — offering room for premium positioning.
Content Optimization Insights
By comparing top-performing listings, you can identify common patterns in titles and images. For example, clear imagery and precise product dimensions often attract more clicks.
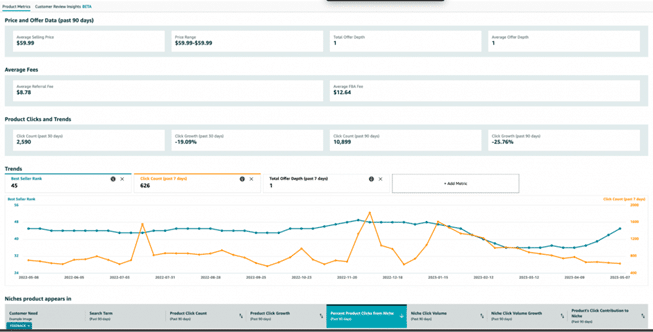
Product Metrics Section
When clicking a specific product, you gain access to deeper insights:
Product & Offer Data (Past 90 Days)
- Average Selling Price
- Price Range
- Total Offer Depth
- Average Offer Depth
These metrics help you understand pricing stability and competition levels.
Average Fees
- Average Referral Fee
- Average FBA Fee
This data helps estimate potential profit margins.
Product Clicks & Growth
- Click Count (30 & 90 Days)
- Click Growth Trends
If short-term growth is negative but long-term growth is positive, it may indicate temporary fluctuations rather than declining demand.
Trends Tab
The Trends graph displays BSR rank, click count, and offer depth over the past year.
For example, yoga mats often see demand spikes in January when fitness resolutions peak, followed by slower months. This reveals seasonality patterns that should be factored into inventory planning.
If you prefer year-round demand, seasonal products may not align with your strategy.
“Niches Product Appears In” Section
This section shows the niches contributing clicks to a product, along with metrics such as:
- Top Search Terms
- Product Click Volume
- Click Growth
- Percentage of Niche Contribution
This data helps identify where growth potential lies and which niches to prioritize for targeting.
Customer Review Insights
One of the most valuable sections, Customer Review Insights, analyzes both positive and negative feedback across products.
For example, yoga mat reviews may highlight issues like odor or lack of grip. Addressing common complaints allows you to design a superior product and differentiate from competitors.
The section also includes visual impact data showing how specific issues influence star ratings. Prioritizing high-impact problems can significantly improve your product positioning.
Search Terms Tab
This section reveals customer search behavior within the niche.
Metrics include:
- Search Volume (360 Days)
- Search Volume Growth (90 & 180 Days)
- Click Share
- Search Conversion Rate
These insights help you detect seasonality patterns and determine which keywords drive the most traffic and conversions.
Insights Section
The Insights tab evaluates niche competitiveness and launch potential using metrics like:
- Average Out-of-Stock Rate
- % of Prime Products
- % Using Sponsored Ads
- Number of Products
- Click Distribution
Low competition combined with healthy demand signals strong opportunity. However, if one brand dominates click share heavily, entering that niche may require significant differentiation.
Niche Trends
The Trends section provides short-term performance data including:
- Search Volume
- Product Count
- Brand Count
- Selling Partner Count
- Search Conversion Rate
By comparing search demand with product count and competition levels, you can determine whether demand is growing faster than supply — a positive sign for new entrants.
Final Thoughts
In today’s competitive eCommerce environment, identifying profitable niches is essential for long-term Amazon success.
Amazon’s Product Opportunity Explorer provides sellers with direct access to valuable data that simplifies niche discovery and product validation.
By understanding search trends, customer feedback, pricing dynamics, and competitive landscape, you can confidently select opportunities backed by real data.
However, once you validate a promising niche, additional tools for product tracking, keyword research, and supplier sourcing are necessary to turn your idea into a scalable business.
Strategic research, combined with data-driven decision-making, is what separates struggling sellers from winning brands on Amazon.