
Fortunately, if you have a professional Amazon Seller Central account, you can access a wide range of business reports designed to help you monitor, manage, and grow your Amazon store effectively.
When managing an online business, making decisions based on accurate, actionable data is essential for long-term growth. Many sellers rely on intuition, but leveraging reliable insights ensures you’re moving your business in the right direction.
Each of these reports offers valuable insights that can guide your decisions related to pricing, advertising, product listings, and overall business strategy.
In this guide, we’ll cover these key points:
- What Amazon Business Reports are.
- Which reports deserve your attention and how to interpret them.
- Other essential Amazon Seller Central reports you should know about.
Keep reading to discover how these resources can drive smarter, data-based growth for your Amazon business.

What Are Amazon Business Reports?
Amazon Business Reports are built-in tools available to sellers that offer detailed insights into the performance of your business on the platform. These reports display important metrics such as total units sold, listing traffic, conversion rates, sales totals, and your Buy Box share.
Additionally, Seller Central offers other types of reports, including those for returns, advertising performance, FBA fulfillment, and stranded inventory.
By regularly reviewing these reports, you can better understand your business’s strengths and weaknesses and make decisions based on actual data rather than guesswork.
Why Seller Central Reports Matter for Your Business?
Seller Central’s reports hold plenty of growth opportunities if you know how to use them. Regularly reviewing and analyzing these insights helps you track progress, identify sales trends, and make proactive adjustments to avoid missed revenue opportunities.
These reports can directly influence your ability to boost sales volume, optimize ad campaigns, improve conversion rates, and manage expenses. Best of all, Amazon allows you to download these reports as CSV files, making it easy to open them in tools like Excel or Google Sheets for deeper analysis.
For example, if you notice one product has an excellent conversion rate but very low traffic, you can focus efforts on increasing visibility for that item.
Which Amazon Seller Reports Should You Focus On?
With so many report options in Seller Central, it can be overwhelming to determine which ones matter most. Let’s simplify it by spotlighting the key reports that can provide the most valuable insights for growing your Amazon business.
Start by heading to the Reports tab and selecting Business Reports. You’ll land on your Sales Dashboard, which provides a quick overview of your total sales. You can filter this view by today, this week, this month, this year, or by custom date ranges.
To the left of the dashboard, you’ll find a list of additional, more detailed reports.
The Detail Page Sales and Traffic By Child Item Report
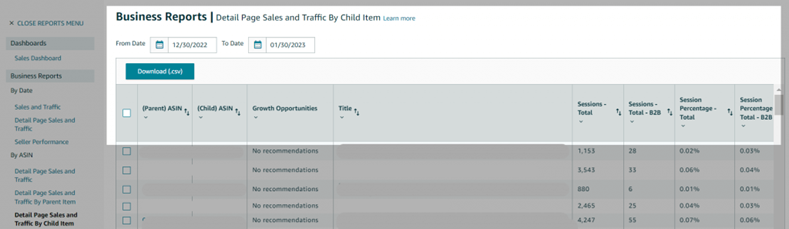
Among all the available reports, one of the most useful for every seller is the Detail Page Sales and Traffic By Child Item report.
This report breaks down performance metrics for each of your products and their variations, giving you a clear picture of how individual listings perform. While overall business metrics are helpful, tracking product-level data gives you a more precise understanding of where adjustments are needed.
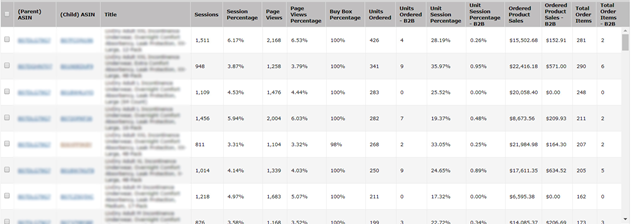
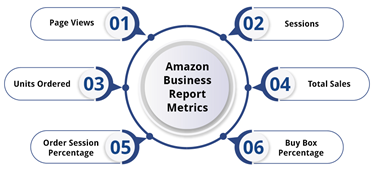
Key metrics you’ll find in this report include:
- Sessions: The number of unique visitors to your product page within 24 hours.
- Page Views: The total number of views, including repeat visits by the same customer.
- Page Views Percentage: The share of page views each product receives relative to your entire catalog.
- Buy Box Percentage: How often your offer wins the Buy Box for a product’s page views.
- Units Ordered: Total units sold within a chosen date range.
- Unit Session Percentage: Your product’s conversion rate (units sold divided by total sessions).
- Ordered Product Sales: Total revenue generated per product.
- Total Order Items: Number of orders placed for a product, regardless of units per order.
While it might seem like a lot of data at first, once you get comfortable interpreting these metrics, you’ll quickly spot trends and opportunities.
How to Understand and Apply Data from Your Business Reports
Once you know where to access these reports, the next step understands how to read them and apply their insights to your business strategy.
The two most critical metrics in these reports are:
- Sessions (how much traffic your listings receive)
- Unit Session Percentage (your conversion rate)
While total sales are important, focusing on increasing traffic and improving your conversion rates will naturally boost overall sales and orders.
Understanding Conversion Rates
On Amazon, a good conversion rate typically ranges between 5-10%, depending on your niche. This is significantly higher than the average ecommerce website, where conversion rates hover around 1-2%. The reason? Most Amazon customers visit the platform ready to make a purchase.
If your conversion rate exceeds 10%, your listing is likely well-optimized with a competitive price point and solid reviews. If it falls below 5%, you may need to evaluate your listing quality, images, pricing, or customer feedback.
How to Improve a Low Conversion Rate
If your conversion rate is underperforming, review these listing elements:
- Images: Ensure your main image is clear, professionally taken, and on a white background. Supporting images and infographics with text descriptions can further improve conversions.
- Title, Bullet Points, and Description: Make sure your copy is clear, informative, and highlights the product’s key features and benefits.
- Price: Evaluate whether your pricing is competitive against similar products.
- Reviews: Negative feedback can significantly impact conversions. Address customer concerns and aim to improve your product and service quality.
- A+ Content: If you’re enrolled in Brand Registry, utilize A+ Content to enhance your product descriptions with visuals and rich content that better inform and persuade shoppers.
Consider A/B testing different elements of your listing to discover what resonates most with your audience.
Tracking and Growing Your Sessions
Your Sessions metric tells you how many people are viewing your listing. Even with a good conversion rate, low traffic will result in fewer sales.
There isn’t a set target number for sessions, but the goal is to attract as much qualified traffic as possible—visitors genuinely interested in your product. Targeting irrelevant keywords might increase visits but lower your conversion rate.
To increase traffic:
- Run Amazon Sponsored Product ads.
- Optimize your product listings with relevant, high-volume keywords.
- Track keyword rankings and monitor competitor listings.
- Drive external traffic from social media, influencer collaborations, and email marketing campaigns.
Buy Box Percentage Insights
Your Buy Box Percentage is another critical metric, especially for arbitrage and wholesale sellers sharing listings with other sellers. A low Buy Box percentage means your offer isn’t consistently available for customers to purchase.
For private label sellers, your Buy Box percentage should remain close to 100% since you’re typically the only seller on your listing. If it drops, check for issues like:
- Low or no stock
- Account health problems
- Pricing discrepancies
- FBA inventory issues
Maintaining a high Buy Box share ensures your listings remain competitive and visible to shoppers.
Final Thoughts
Amazon’s Business Reports in Seller Central provide powerful insights that can help you manage, optimize, and grow your business. By focusing on key metrics like Sessions, Conversion Rate, and Buy Box Percentage, you can make informed, strategic decisions to improve your sales performance.
Review these reports regularly, make data-backed adjustments, and test improvements over time to ensure your Amazon business stays competitive and profitable.