Building a successful Amazon business requires more than just attracting customers—it requires earning their trust and loyalty over time.
To achieve that, brands need a clear understanding of their audience. Knowing what customers want, what interests them, and how they make purchasing decisions allows sellers to create personalized marketing strategies that resonate with shoppers and encourage conversions.
The key to gaining these insights is data.
Introduced in 2019, Amazon Brand Analytics gives brand owners access to valuable customer and marketplace data. By leveraging these insights, brands can better understand buyer behavior, strengthen their marketing efforts, increase brand visibility, and drive higher revenue.
In this guide, we’ll explore Amazon Brand Analytics, its reports, and how brands can use it to improve performance and grow sales.

What Is Amazon Brand Analytics?
Amazon Brand Analytics (ABA) is a reporting and insights tool designed specifically for sellers enrolled in Amazon Brand Registry.
The platform provides detailed information about customer behavior, including:
- The keywords shoppers use to discover products
- Products customers compare before making a purchase
- Frequently purchased-together items
- Products customers buy repeatedly
In addition to shopping behavior, ABA also provides demographic information such as customer age, gender, income range, location, and marital status.
These insights can help brands:
- Improve visibility through targeted advertising
- Increase sales with better pricing and promotional strategies
- Understand consumer behavior and market demand
- Expand product offerings based on customer preferences
- Stay competitive within their category
One of the biggest advantages of Amazon Brand Analytics is that it presents complex data in a simple and user-friendly format, making it easier to identify opportunities and take action.
Eligibility Requirements for Amazon Brand Analytics
Amazon Brand Analytics is available to sellers who are enrolled in Amazon Brand Registry.
If you do not see the Brand Analytics section in your Seller Central account, it likely means your brand has not yet completed the registration requirements.
Once your brand is successfully registered, the analytics dashboard becomes available through Seller Central.
Where to Access Amazon Brand Analytics
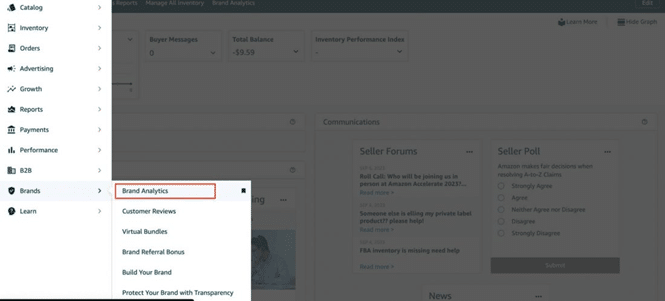
Brand-registered sellers can access the tool directly from Seller Central.
Simply log in to your account and navigate to the Brand menu in the left-hand navigation panel. Under this section, you will find Brand Analytics, where all available reports can be accessed.
Reports Available in Amazon Brand Analytics
The Brand Analytics dashboard is divided into two primary categories:
Search Analytics
- Search Catalog Performance
- Search Query Performance
- Top Search Terms
Consumer Behavior Analytics
- Repeat Purchase Behavior
- Demographics
- Market Basket Analysis
Together, these reports provide a detailed view of the customer journey and help brands make more informed business decisions.
Search Catalog Performance Report
The Search Catalog Performance report helps sellers understand how shoppers engage with products throughout the search and purchase process.
For each ASIN, Amazon provides metrics related to every stage of the sales funnel.
Search Funnel – Impressions
This section measures how often products appear in Amazon search results.
Key metrics include:
- Total impressions generated during the selected period
- Median product rating displayed alongside search results
Search Funnel – Clicks
These metrics focus on customer engagement after seeing a product in search results.
Important measurements include:
- Total clicks or product detail page views
- Click-Through Rate (CTR), which measures clicks relative to impressions
Search Funnel – Cart Adds
This section tracks how often customers add products to their carts after finding them through search.
Metrics include:
- Total cart additions generated from search results
Search Funnel – Purchases
Purchase metrics help sellers evaluate how effectively listings convert visitors into buyers.
These include:
- Total purchases originating from search
- Revenue generated through search traffic
- Conversion rate from clicks to purchases
Shipping Speed Metrics
Amazon also provides shipping-related insights, including:
- Same-Day Delivery availability
- One-Day Delivery availability
- Two-Day Delivery availability
These metrics reveal how shipping options influence customer behavior at every stage of the buying journey.
For example, if a product receives many impressions but few clicks, it may indicate that the listing needs stronger images, titles, or keyword relevance.
Likewise, a high number of cart additions with low purchase volume may suggest checkout friction or customer hesitation before completing the transaction.
Understanding these patterns allows sellers to make improvements that increase conversion rates.
Search Query Performance Report
The Search Query Performance report highlights the search terms that drive traffic to your products.
It provides data for both overall brand performance and individual ASIN performance.
Brands can analyze customer activity throughout the purchase journey using metrics such as:
- Search volume
- Impressions
- Clicks
- Cart additions
- Purchases
Search Query Score
This metric ranks search terms according to popularity and search volume.
Search Query Volume
Displays how frequently a specific keyword is searched on Amazon.
Impression Metrics
The report includes:
- Total impressions generated by a keyword
- Brand-specific impressions
- Brand share of total impressions
For ASIN-level reporting, sellers can also view:
- ASIN impression count
- ASIN impression share
Click Metrics
This section tracks customer engagement after search results are displayed.
Available metrics include:
- Total clicks
- Brand clicks
- Brand click share
- Click rate percentage
The report also provides average pricing information and shipping speed data associated with customer interactions.
Cart Add Metrics
Cart-add performance includes:
- Total cart additions
- Cart-add rate
- Brand or ASIN cart-add share
- Median pricing information
- Shipping speed performance
Purchase Metrics
Purchase reporting covers:
- Total purchases
- Purchase rate
- Brand or ASIN purchase share
- Product pricing
- Shipping-related metrics
These insights help sellers refine advertising campaigns, optimize product listings, and improve conversion rates across high-performing search terms.
Top Search Terms Report
Understanding what customers search for can significantly improve marketing and product visibility.
The Top Search Terms report identifies the most popular search queries within a selected period.
For every search term, Amazon displays:
- Search Frequency Rank
- Top-clicked products
- Top-clicked categories
- Top-clicked brands
Search Frequency Rank
This metric ranks keywords based on how often customers search for them.
Top Clicked Products
The report highlights the three products that receive the highest number of clicks for a particular search term.
Top Clicked Categories
Sellers can also identify which categories receive the most engagement from specific searches.
Top Clicked Brands
This section reveals the brands that generate the highest level of shopper interest for each keyword.
Additionally, sellers can review:
- Click Share
- Conversion Share
These metrics provide deeper insights into product performance and customer preferences, making it easier to identify profitable opportunities.
Repeat Purchase Behavior Report
Acquiring customers is important, but retaining them is often more valuable.
The Repeat Purchase Behavior report helps brands understand customer loyalty and repurchase trends.
Total Orders
Shows the total number of orders generated by a brand or ASIN.
Repeat Ordered Product Sales
This section includes:
- Revenue from repeat buyers
- Percentage change from previous periods
- Share of total sales generated by repeat purchases
Repeat Ordered Units
Tracks the number of units purchased by returning customers and compares performance against previous reporting periods.
Repeat Customer Count
Measures the total number of customers who placed multiple orders during the selected timeframe.
Repeat Customer Share
This metric calculates the percentage of returning customers relative to all customers who purchased the product.
These insights help brands identify products with strong customer loyalty and optimize marketing efforts around them.
Demographics Report
The Demographics Report provides a detailed overview of the customers purchasing your products.
Brands can access information such as:
- Age groups
- Gender
- Household income
- Education level
- Marital status
Understanding these characteristics helps businesses create more targeted messaging and marketing campaigns both on and off Amazon.
For example, if a skincare brand discovers that most buyers are women aged 18–24 with moderate household incomes, it can tailor its advertising content to better appeal to that audience.
Market Basket Analysis Report
Increasing average order value is one of the most effective ways to improve profitability.
The Market Basket Analysis report identifies products that customers commonly purchase together.
For example, shoppers purchasing yoga mats may also frequently buy:
- Athletic footwear
- Workout apparel
- Fitness accessories
By understanding these buying patterns, brands can create bundles, cross-sell complementary products, and improve overall sales performance.
The report includes:
- Product title
- Product ASIN
- Combination percentage
These insights help sellers discover valuable bundling opportunities and increase revenue per order.
Benefits of Amazon Brand Analytics
Access Reliable Marketplace Data
Amazon Brand Analytics provides direct marketplace insights sourced from Amazon itself.
This data gives sellers a clear understanding of search behavior, customer interests, and purchasing trends across the platform.
Better Understand Your Audience
The demographic data available within ABA helps brands identify their ideal customers and tailor marketing efforts accordingly.
Analyze Shopping Behavior
Repeat purchase metrics reveal which products generate customer loyalty and long-term value.
These insights can guide advertising investments and product development decisions.
Discover High-Converting Keywords
Search reports help sellers identify keywords that generate strong engagement, cart additions, and purchases.
Brands can use this information to improve SEO, optimize PPC campaigns, and allocate advertising budgets more effectively.
Final Thoughts
Growing an Amazon business requires more than intuition—it requires data-driven decision-making.
Amazon Brand Analytics gives brand owners valuable insights into customer behavior, keyword trends, shopping patterns, and purchase activity. By leveraging these reports, sellers can optimize listings, improve advertising performance, and create stronger customer relationships.
When combined with a strategic marketing approach and continuous optimization, Amazon Brand Analytics can become a powerful resource for increasing visibility, improving conversions, and driving long-term growth on Amazon.