
Understanding Amazon Vendor Central reports can be challenging, especially when you have multiple data points, reports, and performance metrics to analyze. However, learning how to interpret these insights is essential for making informed decisions and improving your brand’s performance on Amazon.
Vendor Central provides access to valuable reporting and analytics that can help brands understand customer behavior, monitor sales performance, evaluate profitability, and plan inventory more effectively. By analyzing these reports regularly, you can identify opportunities, address performance issues, and build a stronger Amazon strategy.
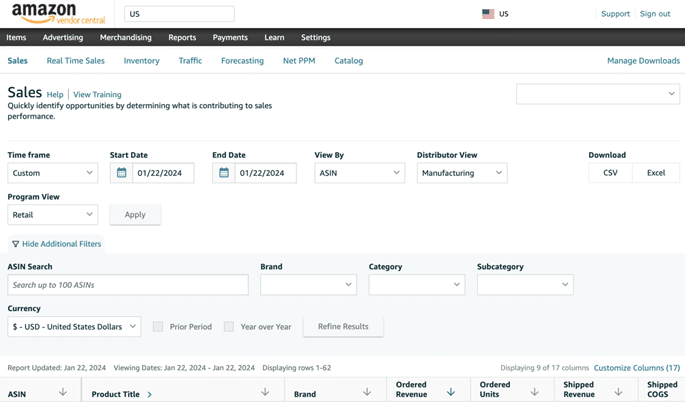
Amazon Vendor Central Reports
Amazon Vendor Central provides analytics through the Reports section, which is generally organized into several key areas, including:
- Sales and Traffic
- Operations
- Consumer Behavior
Let’s begin with the reports focused on customer and consumer behavior.
Amazon Search Terms Report
The Amazon Search Terms Report provides valuable insights into the search queries customers use when discovering products. It helps you identify search terms that generate clicks and conversions, making it easier to understand customer intent and improve your product strategy.
By analyzing these search terms, brands can discover relevant keywords to target in their listings and advertising campaigns. The report can also help identify low-performing or irrelevant search terms that may be contributing to inefficient advertising spend.
Repeat Purchase Behavior
The Repeat Purchase Behavior report provides insights into how often customers return to purchase your products. It separates orders from new customers and returning customers during a specific period.
This information can help brands understand customer loyalty and determine how much of their sales come from first-time buyers versus repeat purchasers. These insights can also support decisions around retention strategies and product development.
Market Basket Analysis
Market Basket Analysis shows which products customers frequently purchase alongside your products. This information can reveal opportunities to create product bundles, improve cross-selling strategies, and promote complementary products.
Understanding these purchasing patterns can also help brands determine which products naturally work together and may appeal to the same customer.
Item Comparison and Alternate Purchase Behavior
The Item Comparison and Alternate Purchase Behavior report provides competitive insights by showing which products customers commonly view alongside yours and which products they purchase after viewing your listing.
This data can help you better understand your competitive landscape and answer important questions such as:
- Who are your main competitors?
- Which products are customers choosing instead of yours?
- Which competitor products are most frequently compared with yours?
Using these insights, you can identify potential gaps in your product offering and make more informed decisions about pricing, positioning, and listing optimization.
Alternate Purchase Report
The Alternate Purchase Report helps identify products that Amazon customers frequently purchase after viewing your product but deciding not to buy it.
The report typically highlights the top products purchased as alternatives and shows how frequently customers select those products instead. This information can help you identify strong competitors and understand why shoppers may be choosing another product over yours.
Demographics
Demographic data provides a deeper understanding of your target audience. It can help brands determine who is purchasing their products and identify opportunities to better tailor their offerings.
Depending on the available data, demographic insights may include factors such as age, household income, education, gender, and marital status. Understanding these characteristics can support more targeted product, marketing, and customer experience strategies.
Customer Reviews
Customer reviews and ratings are an important source of social proof on Amazon. Shoppers often rely on reviews when comparing products and deciding what to purchase.
Monitoring review trends can help brands understand customer satisfaction, identify recurring complaints, and discover areas where products or customer experiences can be improved. Keeping track of ratings and feedback can therefore play an important role in maintaining a strong brand reputation.
Sales Diagnostics Page
The Sales Diagnostics page is part of the Sales and Traffic dashboard and is designed to help brands identify sales opportunities and understand changes in product performance.
Both summary and detailed views allow you to compare important metrics over different periods. This makes it easier to identify positive or negative changes and determine what may be influencing sales.
Sales Performance Trends
The Sales Performance Trends report allows brands to monitor important performance indicators such as glance views, revenue, units sold, and conversion rates.
Tracking these KPIs over time can help you identify sales trends and understand the factors that may be driving changes in product performance. This can also help you determine where additional optimization or investment may be needed.
Geographic Sales Insights
Geographic Sales Insights provides information about where your products are being purchased and shipped.
You can use this report to identify sales trends across different states, cities, and ZIP codes. Understanding geographic demand can help brands identify high-performing markets and recognize opportunities for regional growth.
Net PPM
Net PPM, or Net Pure Product Margin, helps brands understand which products are contributing most effectively to profitability. It takes into account the cost of goods sold and other applicable costs or services to provide a clearer picture of product-level margins.
The report can also help you compare performance using metrics such as:
- Percentage of total
- Prior period
- Previous year
These comparisons make it easier to identify profitable products and understand how margins are changing over time.
Pre-Orders
The Pre-Orders report helps brands monitor the performance of products that are launching or accepting orders before their official availability.
This information can be particularly useful for evaluating demand for new products and understanding how customers respond before a full launch.
Traffic Diagnostic
The Traffic Diagnostic report helps brands analyze changes in product traffic and conversion performance.
By comparing glance views and conversions against industry benchmarks, previous periods, and previous years, you can gain a clearer understanding of whether traffic changes are temporary or part of a broader performance trend.
Real-Time Sales
The Real-Time Sales feature provides sales information from the previous 24 hours for a specific ASIN.
This allows brands to get a more immediate view of product performance rather than relying exclusively on longer reporting periods. Real-time data can be useful when monitoring the impact of promotions, campaigns, launches, or other short-term changes.
Forecast and Inventory Planning
Effective inventory planning is essential for maintaining steady sales and avoiding problems such as overstocking, understocking, and stockouts.
Vendor Central forecasting reports use demand data to help brands estimate future inventory requirements. These insights can support more informed purchasing and inventory decisions for upcoming periods.
The available forecast types include:
Mean Forecast: This represents the estimated level of customer demand based on the available forecasting data.
P90 Forecast: This forecast indicates that Amazon has a 90% probability of purchasing the stated demand level or less, while there is a 10% probability that demand could be higher.
P80 Forecast: This indicates an 80% probability that Amazon will purchase the stated demand level or less, with a 20% possibility of higher demand.
P70 Forecast: This represents a 70% probability that Amazon will purchase the stated demand level or less, while there is a 30% possibility that demand will exceed the forecast.
By comparing different forecast levels, brands can make more balanced inventory decisions and prepare for fluctuations in customer demand.
Common Features of Vendor Central and Seller Central
When selling products on Amazon, it is important to understand how Vendor Central and Seller Central differ. While both platforms support Amazon businesses, their operating models are not the same.
How Amazon Vendor Central Works
Some of the key characteristics of Vendor Central include:
- Vendor Central is generally an invite-only program.
- Amazon typically controls the retail price of products.
- Brands sell their products directly to Amazon.
- Logistics and fulfillment options are more limited.
- Vendors can access a broad range of advertising opportunities.
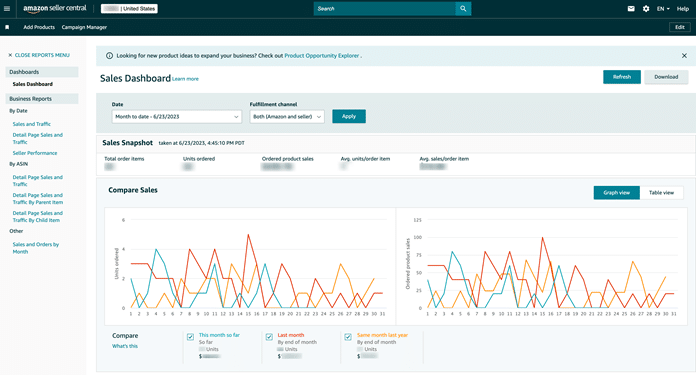
Seller Central operates differently, with some of its primary characteristics including:
- Sellers can generally register and create accounts without an invitation.
- Sellers have greater control over product pricing.
- Sellers sell products directly to customers through Amazon marketplaces.
- Fulfillment and logistics options are more flexible.
- Advertising options may differ from those available through Vendor Central.
Alongside Vendor Central and Seller Central, manufacturers and distributors can also explore Amazon Business to reach business customers. This provides an opportunity to sell to organizations that may place larger-volume orders and can help brands expand their customer base.
Amazon Business can be particularly useful for manufacturers, wholesalers, and distributors looking to grow their presence among professional buyers and business organizations.
Final Thoughts
Understanding Amazon Vendor Central reports is an important step toward improving your decision-making and overall business performance on Amazon. These reports provide valuable insights into customer behavior, sales trends, profitability, competition, traffic, and inventory requirements.
By consistently reviewing the right metrics and turning those insights into actionable strategies, brands can identify growth opportunities, improve operational efficiency, and build a stronger presence on Amazon.