
Growing an Amazon business for the long term requires more than simply driving traffic and generating sales. Building lasting customer relationships and brand loyalty starts with understanding the people who purchase your products. Thats where Amazon Brand analytics comes.
You need to know what customers are searching for, what products they consider before buying, what influences their purchasing decisions, and which products they may purchase again. These insights can help you create a more personalized marketing strategy that connects with your target audience and encourages them to choose your brand.
However, making informed decisions requires reliable data.
Amazon Brand Analytics gives eligible brand owners access to valuable information about customer searches, shopping behavior, product comparisons, repeat purchases, and more.
By using these insights effectively, brands can improve their marketing strategies, strengthen their presence on Amazon, and identify opportunities to increase revenue.
Let’s take a closer look at Amazon Brand Analytics, the reports it offers, and how brands can use this data to make better business decisions.
What Is Amazon Brand Analytics?
Amazon Brand Analytics is a collection of reporting tools designed to give registered brand owners deeper insights into how shoppers interact with their products on Amazon.
The platform provides useful information about several parts of the customer journey, including:
- The keywords and search terms customers use to discover products
- Products shoppers view, compare, and purchase after seeing your offers
- Products that customers frequently purchase together
- The number of customers who return to purchase your products again
Brand Analytics can also provide demographic information related to shoppers, including factors such as age, gender, household income, education, marital status, and location.
With these insights, brands can make more informed decisions about:
- Improving product visibility through more targeted advertising
- Increasing sales through competitive pricing and compelling offers
- Understanding shopping behavior and identifying new customer opportunities
- Expanding or adjusting their product portfolio based on customer demand
The real value of Amazon Brand Analytics comes from turning large amounts of customer data into actionable information. Instead of relying entirely on assumptions, brands can use actual marketplace insights to understand what is happening throughout the shopping journey.
Amazon Brand Analytics Eligibility Requirements
Amazon Brand Analytics is available to sellers whose brands are enrolled in Amazon Brand Registry.
If the Brand Analytics section does not appear in your Seller Central account, your account or brand may not currently meet Amazon’s eligibility requirements.
For brands interested in accessing these reports, completing the Amazon Brand Registry process is an important first step.
Where Can You Find Amazon Brand Analytics?
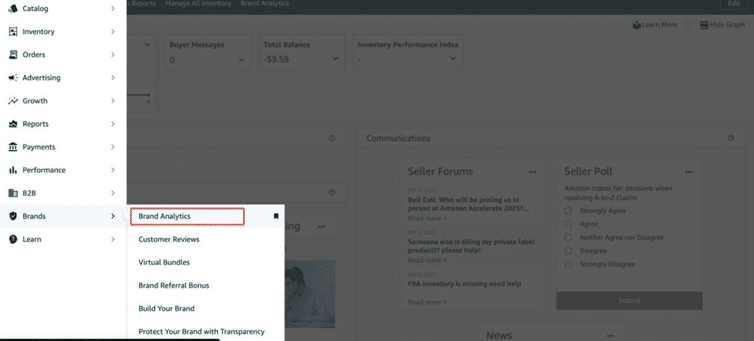
Once your brand is registered and eligible, you can access Brand Analytics through your Seller Central account.
After logging in, navigate to the Brand section from the left-hand menu and select Brand Analytics.
From there, you can access the available reports and explore data related to search performance, customer behavior, and purchasing patterns.
What Reports Are Available in Amazon Brand Analytics?
The Amazon Brand Analytics dashboard contains reports that can help you understand both search activity and customer purchasing behavior.
These reports are broadly divided into two areas:
- Search Analytics
- Consumer Behavior Analytics
Under Search Analytics, you can access:
- Search Catalog Performance
- Search Query Performance
- Top Search Terms
Under Consumer Behavior Analytics, you can find:
- Repeat Purchase Behavior
- Demographics
- Market Basket Analysis
Together, these reports provide a broader view of the customer journey. Instead of only looking at sales numbers, brands can examine how shoppers discover, click, add, purchase, and return to products.
Search Catalog Performance
Search Catalog Performance helps brands understand how shoppers interact with their products as they move through different stages of the Amazon search funnel.
The dashboard provides ASIN-level data and allows you to examine how individual products perform throughout the customer journey.
Some of the key metrics include:
Search Funnel – Impressions
Impressions: This represents the total number of times an ASIN was shown across relevant search queries during the selected reporting period.
Rating (Median): This shows the median product rating associated with the ASIN while it appeared in search results.
Search Funnel – Clicks
Clicks: This is the total number of times shoppers clicked on or viewed the ASIN from Amazon search results during the selected timeframe.
Click Rate (CTR): CTR measures the percentage of impressions that resulted in clicks from search results.
Search Funnel – Cart Adds
Cart Adds: This metric shows how many times shoppers added an ASIN to their cart after discovering it through search results.
Search Funnel – Purchases
Purchases: This represents the total number of purchases generated from Amazon search results during the selected period.
Search Traffic Sales: This shows the total sales revenue generated through purchases originating from search traffic.
Conversion Rate: Conversion rate measures the percentage of clicks that ultimately resulted in purchases.
These metrics allow brands to evaluate how customers move from product discovery to purchase.
For example, a product may receive a large number of impressions but only a small percentage of clicks. This can indicate that the listing is not attracting enough attention or may not align closely with shopper intent.
In such cases, brands can review elements such as the main product image, title, pricing, and overall search-result presentation to improve click-through performance.
On the other hand, a product may receive plenty of clicks and cart additions without generating a similar number of purchases. This may indicate friction somewhere between product consideration and checkout.
Brands can investigate factors such as pricing, shipping expectations, product information, reviews, or promotional offers and make adjustments accordingly.
Shipping Speed Metrics
Search Catalog Performance also provides shipping-related insights that can help brands understand whether delivery speed may influence customer behavior.
The available shipping metrics include:
Same-Day Shipping Speed: Measures how often an ASIN displayed a same-day delivery message at different stages of the search journey.
1-Day Shipping Speed: Tracks how frequently the ASIN displayed a one-day delivery message when it was viewed, clicked, added to a cart, or purchased.
2-Day Shipping Speed: Measures how often the ASIN displayed a two-day delivery message during customer interactions.
These metrics can help brands understand the possible relationship between delivery speed and shopping activity.
For instance, if products with faster delivery availability consistently receive stronger engagement, shipping speed may be an important factor worth considering when evaluating overall listing performance.
Search Query Performance
Search Query Performance gives brands a more detailed understanding of the search terms that shoppers use to discover their products.
The report provides information about individual search queries and shows how your brand performs across important stages of the shopping journey, including impressions, clicks, cart additions, and purchases.
You can generally view this information at both the brand level and the ASIN level.
The brand view helps you evaluate overall performance across your brand, while the ASIN view allows you to examine how individual products perform for specific search queries.
Key Search Query Metrics
Search Query Score: Shows the ranking of search queries based on their performance within the report.
Search Query Volume: Represents the number of times shoppers searched for a particular query during the selected period.
Impressions: Shows how often products appeared in Amazon search results for a specific query.
Within impressions, several additional metrics can help you understand visibility:
Total Count: The total number of product impressions generated for the search query.
Brand Count: The number of impressions received by products from your brand.
Brand Share: The percentage of total search impressions represented by your brand.
These metrics can help you determine how visible your brand is compared with the broader group of products appearing for a particular customer query.
ASIN-Level Visibility
When viewing search query information for an individual ASIN, additional metrics become available.
ASIN Count: The number of impressions your specific ASIN receives for a particular search query.
ASIN Share: The percentage of total impressions associated with the ASIN for that query.
Click Metrics
The dashboard also provides information about clicks generated from a search query.
These include:
- Total Click Count
- Brand Click Count
- Brand Click Share
Click Rate: This measures the percentage of shoppers who clicked on products after entering a specific search query.
For example, if a query receives 10 search interactions and two result clicks are recorded, the click rate would be 20%.
Price and Shipping Information
Search Query Performance can also give brands useful context about pricing and delivery.
Price (Median): Represents the median price of products associated with the search query at the time the impression occurs.
Brand Price (Median): Shows the median price of products from your brand associated with the search query.
Shipping-related metrics include:
- Same-Day Shipping Speed
- 1-Day Shipping Speed
- 2-Day Shipping Speed
These can help brands evaluate whether price and delivery expectations may be affecting search performance.
Cart Add Metrics
The dashboard also provides insights into how often shoppers add products to their carts after conducting a search.
Cart-related metrics can include:
- Total Count
- Cart Add Rate
- Brand or ASIN Count
- Brand or ASIN Share
- Price (Median)
- Brand or ASIN Price (Median)
- Same-Day Shipping Speed
- 1-Day Shipping Speed
- 2-Day Shipping Speed
These figures can help you understand whether shoppers are moving from simple product discovery toward stronger purchase intent.
Purchase Metrics
Purchase data provides another important layer of information.
Available metrics may include:
- Total Purchase Count
- Purchase Rate
- Brand or ASIN Count
- Brand or ASIN Share
- Price (Median)
- Brand or ASIN Price (Median)
- Same-Day Shipping Speed
- 1-Day Shipping Speed
- 2-Day Shipping Speed
Looking at these metrics together can help brands identify which queries generate meaningful business results rather than simply producing impressions or clicks.
The Search Query Performance dashboard is particularly useful for refining keyword targeting, advertising strategies, listing optimization, and broader search visibility efforts.
Top Search Terms
Understanding exactly what shoppers search for is one of the most valuable types of information available to an Amazon brand.
The Top Search Terms report helps brands identify frequently searched terms during a selected period.
Rather than relying solely on assumptions or third-party keyword research, you can use this report to see which search terms are attracting significant shopper interest on Amazon.
Search terms are ranked according to their search frequency, and the report also highlights the top products, categories, and brands receiving clicks for each term.
Important Top Search Terms Metrics
Search Frequency Rank: Indicates where a search term ranks according to its frequency of use.
- Top Clicked Products: Shows the three products receiving the highest number of clicks for a particular search term.
- Top Clicked Categories: Identifies the three categories most frequently associated with clicks for the search term.
- Top Clicked Brands: Displays the top three brands receiving clicks for that search query.
These insights can help brands identify emerging customer interests, discover competitive patterns, and better understand which products are capturing attention.
The report also provides additional information for the leading clicked products.
Click Share: Represents the percentage of clicks received by an ASIN compared with the total clicks generated by products appearing for the search term.
Conversion Share: Shows the percentage of conversions attributed to an ASIN compared with the total conversions generated from the search results for that query.
Taken together, these metrics can help brands identify valuable search opportunities and understand where shoppers are directing their attention.
Repeat Purchase Behavior Report
Generating an initial sale is only one part of growing a successful Amazon brand. Understanding whether customers return to purchase again can provide valuable insights into customer retention.
The Repeat Purchase Behavior report provides data about repeat orders and customer purchasing patterns at both the brand and ASIN levels.
This information can help brands assess customer loyalty and determine how much of their business comes from returning shoppers.
The report includes several important metrics.
Total Number of Orders
This metric shows the total number of orders generated by the selected brand or ASIN during the reporting period.
A single order may contain multiple product units.
Repeat Ordered Product Sales
This section focuses on sales generated by customers who purchased more than once within the selected timeframe.
Sales: Represents the revenue generated from customers who placed multiple orders.
Change vs. Prior Period: Shows the percentage change compared with the closest previous reporting period.
% Share of Total Sales: Indicates what percentage of overall product sales came from repeat orders.
Repeat Ordered Units
This section measures the number of product units purchased by repeat customers.
Units: Represents the total units purchased by customers who placed more than one order during the reporting period.
Change vs. Prior Period: Shows how repeat purchase units changed compared with the previous comparable timeframe.
% Share of Total Sales: Indicates the proportion of total unit sales represented by repeat purchases.
Repeat Customer Count
Repeat Customers: Shows the number of distinct customers who placed multiple orders within the selected reporting period.
Change from Previous Period: Measures the percentage change in the number of repeat customers compared with the preceding comparable period.
Repeat Customer Share
Customer Share: Represents the percentage of customers who made repeat purchases compared with the total number of customers placing orders during the selected period.
Change from Previous Period: Shows how repeat customer share has changed compared with the previous reporting period.
These insights can help brands determine whether their products are generating one-time purchases or developing a stronger base of returning customers.
Demographic Report
Knowing who your customers are can make your marketing strategy much more precise.
The Demographic report provides information that can help brands understand their audience in greater detail.
Depending on the available data, brands can gain insights into factors such as:
- Age
- Gender
- Household income
- Education
- Marital status
- Location
This information can help you identify patterns within your customer base and better understand which audience segments are most relevant to your products.
Brands can then use these insights when developing marketing messaging, advertising strategies, product positioning, and campaigns both on and outside Amazon. Rather than creating one broad message for everyone, demographic insights can help you build marketing communication around the characteristics of the people most likely to purchase your products.
Market Basket Analysis
Customers rarely purchase products completely at random.
In many categories, shoppers naturally buy complementary products together. Understanding these purchasing relationships can help brands identify opportunities to increase average order value.
Consider a simple example.
Suppose shoppers frequently purchase a yoga mat along with workout clothing and sports shoes. If your brand only sells the yoga mat, customers may purchase the complementary products from other brands.
Market Basket Analysis helps identify these purchasing patterns.
By understanding which products shoppers commonly buy together, brands can explore opportunities such as product bundles, cross-selling campaigns, complementary product development, and strategic promotions.
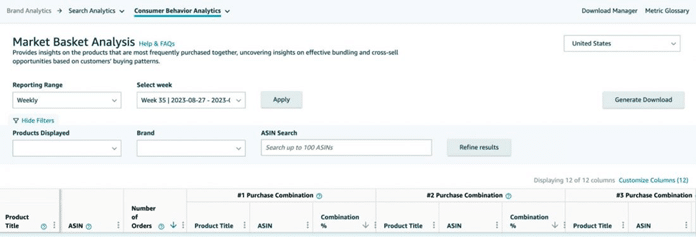
The report provides information about leading purchase combinations, including:
- Product Title
- Product ASIN
- Combination Percentage
The Combination % indicates how frequently the products are purchased together within the relevant dataset.
These insights can help brands identify complementary products and create offers that better match customer purchasing behavior.
For example, a brand selling fitness accessories may use these insights to evaluate whether customers are frequently pairing certain products. That information can support bundle creation and cross-selling strategies designed to increase the value of each order.
Final Thoughts
Building and scaling an Amazon business requires more than monitoring sales and advertising results.
Brands need to understand what customers search for, how shoppers interact with listings, what drives purchases, which products are frequently purchased together, and whether customers return for future orders.
Amazon Brand Analytics brings many of these insights together in one place.
By analyzing search performance, customer behavior, demographics, repeat purchases, and market basket trends, brands can make more informed decisions about their listings, advertising, pricing, product strategy, and customer acquisition efforts.
At the same time, Brand Analytics should be viewed as one part of a larger Amazon growth strategy.
Brands can combine these insights with keyword research, competitor analysis, listing optimization, advertising management, pricing analysis, and performance tracking to build a more complete picture of their marketplace performance.
For businesses that want to turn Amazon data into practical growth strategies, working with an experienced Amazon team can also help simplify the process and ensure important opportunities are not overlooked.
At SAECOM FBA PRO, we help Amazon sellers and brands improve their marketplace performance through strategic optimization, advertising support, listing improvements, competitor analysis, and other Amazon growth services.
The right data can tell you what is happening. The right strategy helps you determine what to do next.